

The diagram shows the graph of y = g(x) . Sketch the graph of each of the
Question:
The diagram shows the graph of y = g(x) . Sketch the graph of each of the following.
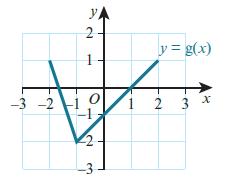
a. y = g(x + 2) + 3
b. y = 2g(x) + 1
c. y = 2 − g(x)
d. y = 2g(−x) + 1
e. y = −2g(x) − 1
f. y = g(2x) + 3
g. y = g(2x − 6)
h. y = g(−x + 1)
Fantastic news! We've Found the answer you've been seeking!
Step by Step Answer:
a y is a translation of the given graph to the left side by 2 and upwards by 3 b y is a transla...View the full answer

Answered By
Fahmin Arakkal
Tutoring and Contributing expert question and answers to teachers and students.
Primarily oversees the Heat and Mass Transfer contents presented on websites and blogs.
Responsible for Creating, Editing, Updating all contents related Chemical Engineering in
latex language
8+ Reviews
22+ Question Solved
Related Book For 

Cambridge International AS And A Level Mathematics Pure Mathematics 1 Coursebook
ISBN: 9781108407144
1st Edition
Authors: Sue Pemberton, Julian Gilbey
Question Posted:
