

The heights, in centimetres, of 54 children are represented in the following diagram. The children are split
Question:
The heights, in centimetres, of 54 children are represented in the following diagram. The children are split into two equal-sized groups: a ‘tall half’ and a ‘short half’.
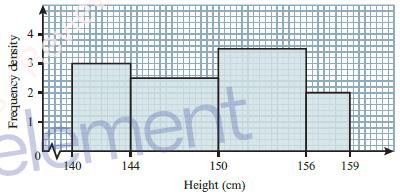
Calculate an estimate of the difference between the mean heights of these two groups of children.
Fantastic news! We've Found the answer you've been seeking!
Step by Step Answer:
Answer The difference between the mean heights of these two c...View the full answer

Answered By
Devendra Singh
Hello! My name is Mark Anthony and I am a Licensed Civil Engineer, and my course expertise are on Mathematics, Statistics and Probability, Physics and Civil Engineering. I have also worked as a tutor on a course hero, I help college students answer their questions on that platform. I wanted wanted to share my knowledge and expertise as well on solutionInn
0 Reviews
10+ Question Solved
Related Book For 

Cambridge International AS & A Level Mathematics Probability & Statistics 1 Coursebook
ISBN: 9781108407304
1st Edition
Authors: Dean Chalmers, Julian Gilbey
Question Posted:
