

The probability distributions for A and B are represented in the diagram. Indicate whether each of the
Question:
The probability distributions for A and B are represented in the diagram.
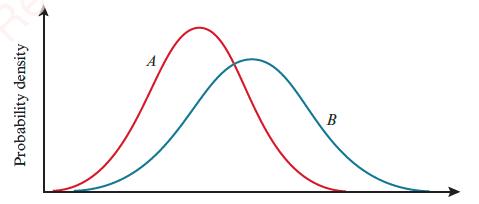
Indicate whether each of the following statements is true or false.
a. μΑ > μΒ
b. σΑ < σB
c. A and B have the same range of values.
d. σ2Α = σ2Β
e. At least half of the values in B are greater than μΑ.
f. At most half of the values in A are less than μΒ.
Fantastic news! We've Found the answer you've been seeking!
Step by Step Answer:
a True The mean of distribution A is greater than the mean of distribution B b Fa...View the full answer

Answered By
Abdul Wahab Qaiser
Before working at Mariakani, I volunteered at a local community center, where I tutored students from diverse backgrounds. I helped them improve their academic performance and develop self-esteem and confidence. I used creative teaching methods, such as role-playing and group discussions, to make the learning experience more engaging and enjoyable.
In addition, I have conducted workshops and training sessions for educators and mental health professionals on various topics related to counseling and psychology. I have presented research papers at conferences and published articles in academic journals.
Overall, I am passionate about sharing my knowledge and helping others achieve their goals. I believe that tutoring is an excellent way to make a positive impact on people's lives, and I am committed to providing high-quality, personalized instruction to my students.
0 Reviews
10+ Question Solved
Related Book For 

Cambridge International AS & A Level Mathematics Probability & Statistics 1 Coursebook
ISBN: 9781108407304
1st Edition
Authors: Dean Chalmers, Julian Gilbey
Question Posted:
