

The values of x shown in the following table are to be represented in a bar chart.
Question:
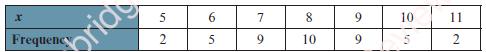
The values of x shown in the following table are to be represented in a bar chart.
a. i. Sketch a curve that shows the shape of the data.
ii. Find the mode, mean and the median of x.
b. The two smallest values of x (i.e. 5 and 5) are changed to 21 and 31. Investigate the effect that this has on the mode, the mean, the median and on the shape of the curve.
c. If, instead, the two largest values of x (i.e. 11 and 11) are changed to –9 and b, so that the mean of x decreases by 1, find the value of b and investigate the effect that this has on the mode, the median and the shape of the curve.
Fantastic news! We've Found the answer you've been seeking!
Step by Step Answer:
Based on the frequency table provided lets address each question stepbystep a i To sketch a curve that shows the shape of the data often referred to as a frequency polygon we connect the midpoints of ...View the full answer

Answered By
Aysha Ali
my name is ayesha ali. i have done my matriculation in science topics with a+ . then i got admission in the field of computer science and technology in punjab college, lahore. i have passed my final examination of college with a+ also. after that, i got admission in the biggest university of pakistan which is university of the punjab. i am studying business and information technology in my university. i always stand first in my class. i am very brilliant client. my experts always appreciate my work. my projects are very popular in my university because i always complete my work with extreme devotion. i have a great knowledge about all major science topics. science topics always remain my favorite topics. i am also a home expert. i teach many clients at my home ranging from pre-school level to university level. my clients always show excellent result. i am expert in writing essays, reports, speeches, researches and all type of projects. i also have a vast knowledge about business, marketing, cost accounting and finance. i am also expert in making presentations on powerpoint and microsoft word. if you need any sort of help in any topic, please dont hesitate to consult with me. i will provide you the best work at a very reasonable price. i am quality oriented and i have 5 year experience in the following field.
matriculation in science topics; inter in computer science; bachelors in business and information technology
_embed src=http://www.clocklink.com/clocks/0018-orange.swf?timezone=usa_albany& width=200 height=200 wmode=transparent type=application/x-shockwave-flash_
11+ Reviews
14+ Question Solved
Related Book For 

Cambridge International AS & A Level Mathematics Probability & Statistics 1 Coursebook
ISBN: 9781108407304
1st Edition
Authors: Dean Chalmers, Julian Gilbey
Question Posted:
