

A student measures the speed v of a trolley as it moves down a slope. The variation
Question:
A student measures the speed v of a trolley as it moves down a slope. The variation of v with time t is shown in this graph.
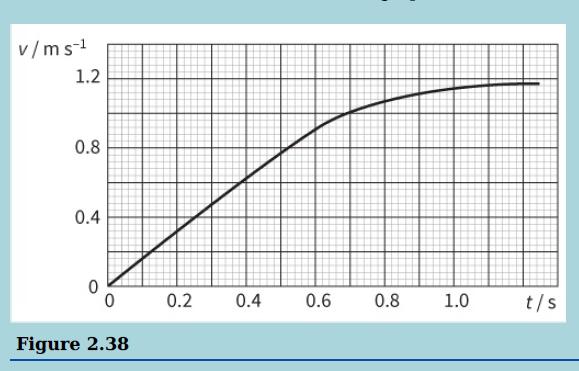
a. Use the graph to find the acceleration of the trolley when t = 0.70 s.
b. State how the acceleration of the trolley varies between t = 0 and t = 1.0 s.
Explain your answer by reference to the graph.
c. Determine the distance travelled by the trolley between t = 0.60 and t = 0.80 s.
d. The student obtained the readings for v using a motion sensor. The readings may have random errors and systematic errors. Explain how these two types of error affect the velocity–time graph.
Fantastic news! We've Found the answer you've been seeking!
Step by Step Answer:
a To find the acceleration of the trolley when t 070 s we need to calculate the slope of the velocitytime graph at that point We draw a tangent to the ...View the full answer

Answered By
Deepak Sharma
0 Reviews
10+ Question Solved
Related Book For 

Cambridge International AS And A Level Physics Coursebook
ISBN: 9781108859035
3rd Edition
Authors: David Sang, Graham Jones, Gurinder Chadha, Richard Woodside
Question Posted:
