

The graph of Figure 23.8 shows how V depends on Q for a particular capacitor. The area
Question:
The graph of Figure 23.8 shows how V depends on Q for a particular capacitor.
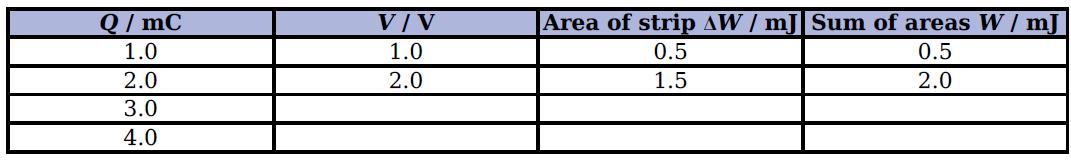
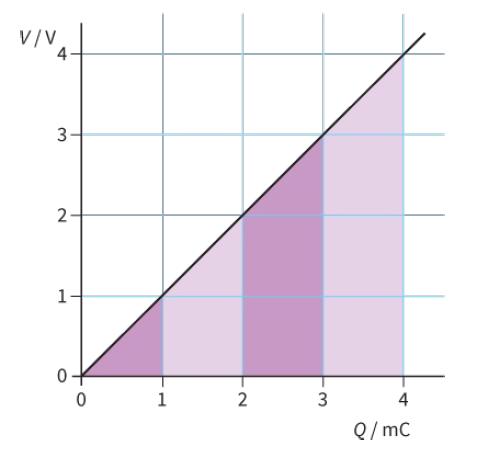 The area under the graph has been divided into strips to make it easy to calculate the energy stored.
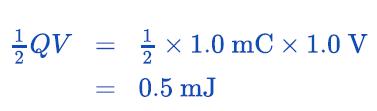
The first strip (which is simply a triangle) shows the energy stored when the capacitor is charged up to 1.0 V. The energy stored is:
Calculate the capacitance C of the capacitor.
Copy Table 23.2 and complete it by calculating the areas of successive strips, to show how W depends on V.
Plot a graph of W against V. Describe the shape of this graph.
Fantastic news! We've Found the answer you've been seeking!
Step by Step Answer:

Related Book For 
Cambridge International AS And A Level Physics Coursebook
ISBN: 9781108859035
3rd Edition
Authors: David Sang, Graham Jones, Gurinder Chadha, Richard Woodside
Question Posted:
