

The table shows the received count rate when a sample of the isotope vanadium-52 decays. a. i.
Question:
The table shows the received count rate when a sample of the isotope vanadium-52 decays.
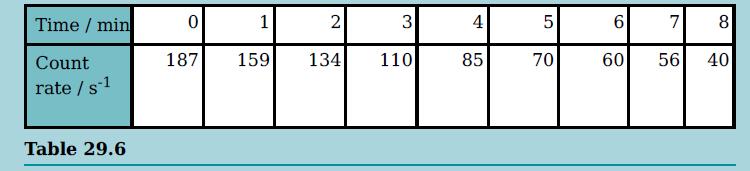
a. i. Sketch a graph of the count rate against the time.
ii. Comment on the scatter of the points.
b. From the graph, determine the half-life of the isotope.
c. Describe the changes to the graph that you would expect if you were given a larger sample of the isotope.
Fantastic news! We've Found the answer you've been seeking!
Step by Step Answer:
a i Sketch a graph of the count rate against the time Timemin 0 1 2 3 4 5 6 7 8 Count rate s 1 187 1...View the full answer

Answered By
Kamalakanta Nayak
I have completed B.Tech and MBA. I have been teaching students both offline and online mode. I teach both physics and math for CBSE, ISC, IB, AP-1,2,C, IGCSE, GCSE, AQA, EDEXCEL, CIE, OCR. I prepare students for NEET, JEE, and MCAT. I work at any student's level from any Curriculum with concept driven Real-life examples and Goal-Oriented Teaching, making the concepts so simple that you can understand it regardless of prior knowledge. Clear your fundamentals and develop problem-solving skills and analytical skills to crack the exam. Get guidance and the opportunity to learn from experienced...
1. I can help you with your assignments or exams or quiz or tutoring.
2. Very strict to the deadlines.
Message me for any help in assignments, live sessions. I am here to help students for all assignments, tests and exams and I will make sure you always get _95% In your subject. Contact me in solutioninn for any help in your semester, projects and for many more things . Also feel free to contact me through solution inn and for any advice related to tutoring and how it works here.thank you.
0 Reviews
10+ Question Solved
Related Book For 

Cambridge International AS And A Level Physics Coursebook
ISBN: 9781108859035
3rd Edition
Authors: David Sang, Graham Jones, Gurinder Chadha, Richard Woodside
Question Posted:
