

The velocitytime graph (Figure 2.20) represents the motion of a car along a straight road for a
Question:
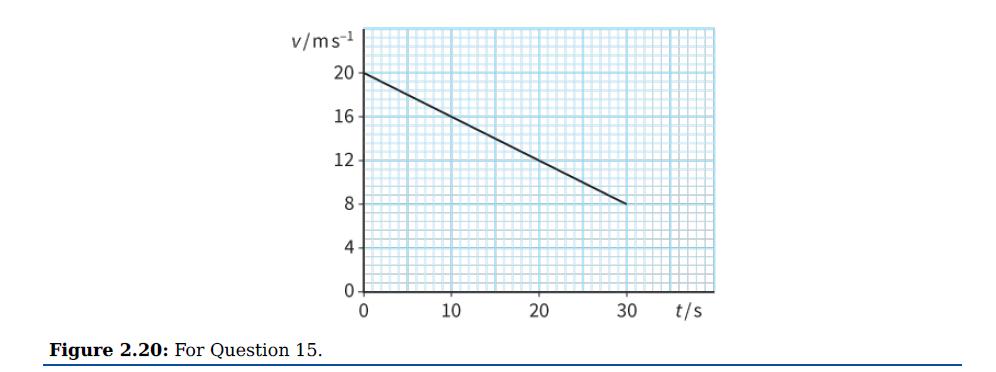
The velocity–time graph (Figure 2.20) represents the motion of a car along a straight road for a period of 30 s.
a. Describe the motion of the car.
b. From the graph, determine the car’s initial and final velocities over the time of 30 s.
c. Determine the acceleration of the car.
d. By calculating the area under the graph, determine the displacement of the car.
e. Check your answer to part d by calculating the car’s displacement using s = ut 1/2 at2.
Fantastic news! We've Found the answer you've been seeking!
Step by Step Answer:
a The motion of car is decreasing The car has neg...View the full answer

Answered By
Anik Kumar Bosu
I am expert in Maths, Physics, Chemistry and Biology. I also teach student from 3 years. Students becomes satisfied by my teaching. So, do not worry.
0 Reviews
10+ Question Solved
Related Book For 
Cambridge International AS And A Level Physics Coursebook
ISBN: 9781108859035
3rd Edition
Authors: David Sang, Graham Jones, Gurinder Chadha, Richard Woodside
Question Posted:
