

Question: Jeff Smith realizes that the first thing he must do is compare the liquidity, leverage, activity, and profitability ratios of the two companies. Using the
Jeff Smith realizes that the first thing he must do is compare the liquidity, leverage, activity, and profitability ratios of the two companies. Using the income statement and balance sheet data shown in Tables 1 €“ 4, prepare a detailed comparison report indicating the strengths and weaknesses of each company.
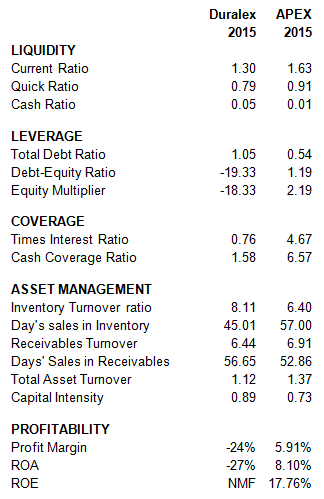
Duralex APEX 2015 2015 LIQUIDITY Current Ratio 1.30 1.63 Quick Ratio 0.79 0.91 Cash Ratio 0.05 0.01 LEVERAGE Total Debt Ratio 1.05 0.54 1.19 Debt-Equity Ratio Equity Multiplier -19.33 -18.33 2.19 COVERAGE Times Interest Ratio 0.76 4.67 Cash Coverage Ratio 1.58 6.57 ASSET MANAGEMENT Inventory Turnover ratio Day's sales in Inventory 8.11 6.40 45.01 57.00 Receivables Turnover 6.44 6.91 Days' Sales in Receivables 56.65 52.86 Total Asset Turnover 1.12 1.37 0.73 Capital Intensity 0.89 PROFITABILITY Profit Margin -24% 5.91% ROA -27% 8.10% ROE NMF 17.76%
Step by Step Solution
3.51 Rating (164 Votes )
There are 3 Steps involved in it
Looking at 2015 ratios APEX has a much better liquidity leverage and profitab... View full answer

Get step-by-step solutions from verified subject matter experts