

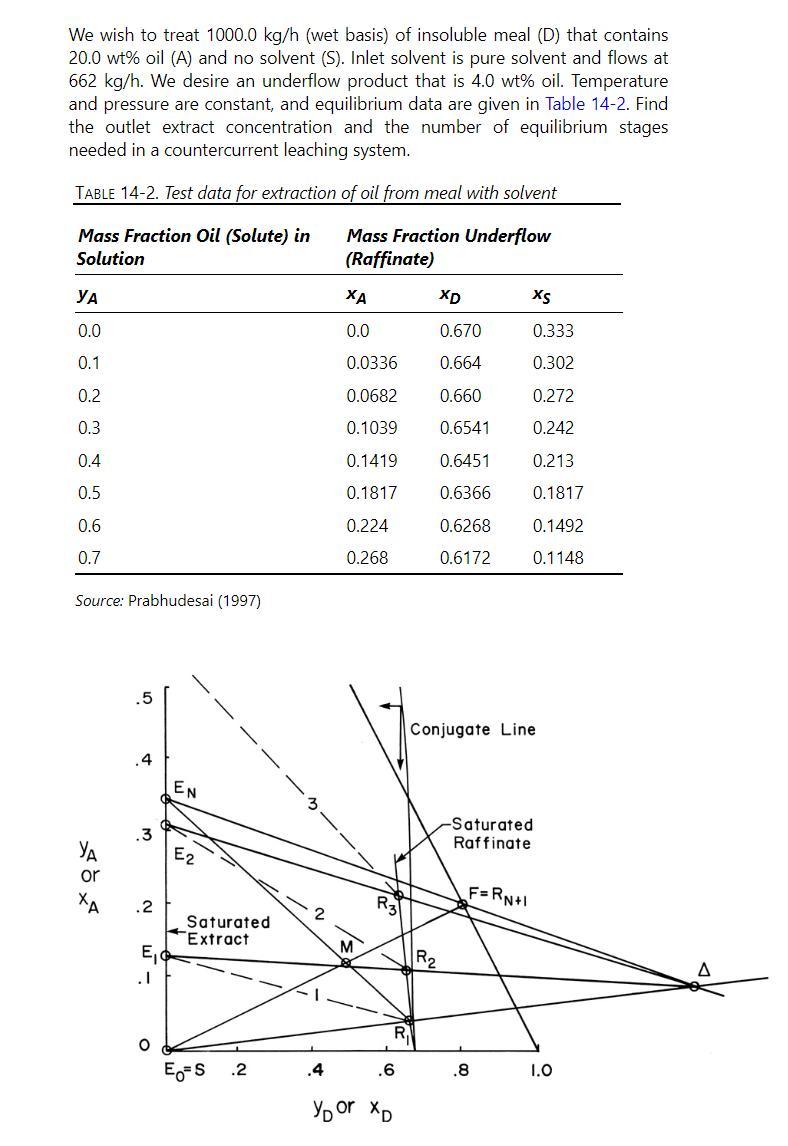
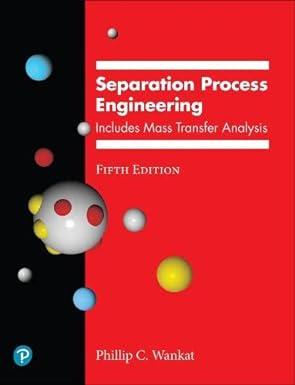
In Example 14-2 and Figure 14-5, we plotted solute mole fractions on the ordinate and solvent mole
Question:
In Example 14-2 and Figure 14-5, we plotted solute mole fractions on the ordinate and solvent mole fractions on the abscissa (x-axis). Instead, we could have plotted solid mole fractions \(\mathrm{x}_{\mathrm{D}}\) or \(\mathrm{y}_{\mathrm{D}}\) on the abscissa. Why is plotting solvent mole fractions on the abscissa the better choice? To answer this question, you will probably need to plot the graph with solid mole fractions on the abscissa so that you can compare with Figure 14-5.
Example 14-2
Step by Step Answer:

This question has not been answered yet.
You can Ask your question!
Related Book For 
Separation Process Engineering Includes Mass Transfer Analysis
ISBN: 9780137468041
5th Edition
Authors: Phillip Wankat
Question Posted:
