

Question: Boyles law can be represented graphically in several ways. Which of the following plots does not correctly represent Boyles law (assuming constant T and n)?
Boyle’s law can be represented graphically in several ways. Which of the following plots does not correctly represent Boyle’s law (assuming constant T and n)? Explain.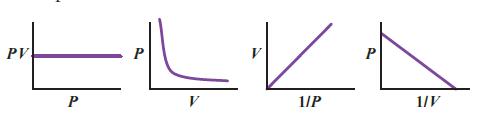
PV P V P KA 1/P 1/V
Step by Step Solution
★★★★★
3.39 Rating (158 Votes )
There are 3 Steps involved in it
1 Expert Approved Answer
Step: 1 Unlock

Question Has Been Solved by an Expert!
Get step-by-step solutions from verified subject matter experts
Step: 2 Unlock
Step: 3 Unlock