

Question: The following plot shows the distribution of speeds for N 2 at 300, 500, and 1000 K. (a) Identify the temperature of the gas for
The following plot shows the distribution of speeds for N2 at 300, 500, and 1000 K.
(a) Identify the temperature of the gas for each curve.
(b) What is the root mean square speed of N2 molecules at 227°C?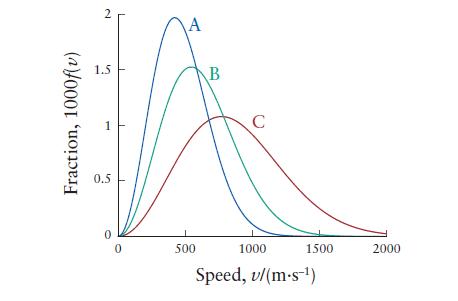
Fraction, 1000f(v) 2 1.5 0.5 0 0 A 500 B C 1000 1500 Speed, v/(m.s-) 2000
Step by Step Solution
★★★★★
3.45 Rating (155 Votes )
There are 3 Steps involved in it
1 Expert Approved Answer
Step: 1 Unlock

a A 300 ... View full answer
Question Has Been Solved by an Expert!
Get step-by-step solutions from verified subject matter experts
Step: 2 Unlock
Step: 3 Unlock