

Examine the phase diagram for iodine shown in Figure 12.39(a). FIGURE 12.39a What state transitions occur as
Question:
Examine the phase diagram for iodine shown in Figure 12.39(a).
FIGURE 12.39a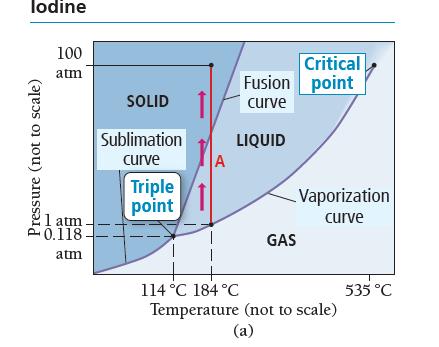
What state transitions occur as we uniformly increase the pressure on a gaseous sample of iodine from 0.010 atm at 185 °C to 100 atm at 185 °C? Make a graph, analogous to the heating curve for water shown in Figure 12.36. Plot pressure versus time during the pressure increase.
Figure 12.36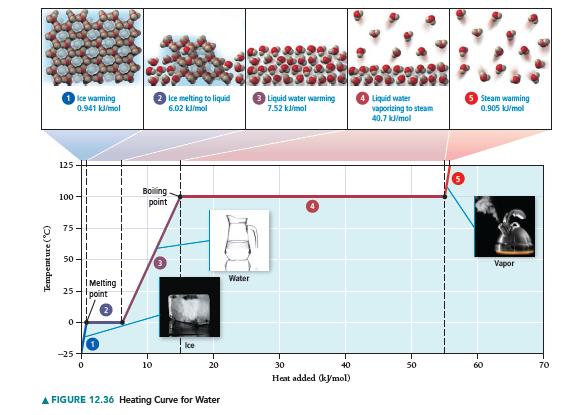
Fantastic news! We've Found the answer you've been seeking!
Step by Step Answer:
gas ...View the full answer

Answered By
Surojit Das
I have vast knowledge in the field of Mathematics, Business Management and Marketing. Besides, I have been teaching on the topics Management leadership, Business Administration, Human Resource Management, Business Communication, Accounting, Auditing, Organizer Behaviours, Business Writing, Essay Writing, Copy Writing, Blog Writing since 2020. It is my personality to act quickly in any emergency situations when students need my services. I am very professional and serious in every questions students asked me at the time of dealing any projects. I have been serving detailed, quality, properly analysed research paper through the years.
91+ Reviews
278+ Question Solved
Related Book For 

Question Posted:
