

The color change accompanying the reaction of phenolphthalein with strong base is illustrated below. The change in
Question:
The color change accompanying the reaction of phenolphthalein with strong base is illustrated below. The change in concentration of the dye can be followed by spectrophotometry (Section 4.9), and some data collected by that approach are given below. The initial concentrations were [phenolphthalein] = 0.0050 mol/L and [OH−] =0.61 mol/L. (Data are taken from review materials for kinetics at chemed.chem.purdue.edu.) (For more details on this reaction see L. Nicholson, Journal of Chemical Education, Vol. 66, p. 725,1989.)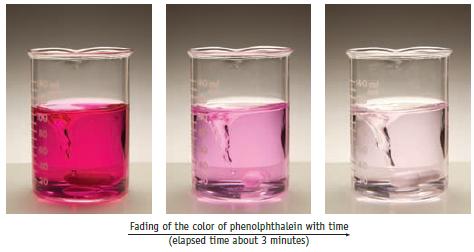

(a) Plot the data above as [phenolphthalein] versus time, and determine the average rate from t = 0 to t = 15 seconds and from t = 100 seconds to t = 125 seconds. Does the rate change? If so, why?
(b) Use a graphical method to determine the order of the reaction with respect to phenolphthalein. Write the rate law, and determine the rate constant.
(c) What is the half-life for the reaction?
Step by Step Answer:

This question has not been answered yet.
You can Ask your question!

Chemistry And Chemical Reactivity
ISBN: 9780357001172
10th Edition
Authors: John C. Kotz, Paul M. Treichel, John Townsend, David Treichel
