

If a logarithmic scale had not been used for the graph of Figure 13.13, what would the
Question:
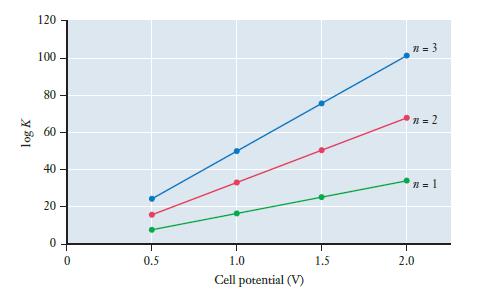
If a logarithmic scale had not been used for the graph of Figure 13.13, what would the plots look like?
Figure 13.13
Fantastic news! We've Found the answer you've been seeking!
Step by Step Answer:
If a logarithmic scale had not been used for the graph of Figure 1313the plots would look very diffe...View the full answer

Answered By
Ayush Mishra
I am a certified online tutor, with more than 3 years of experience in online tutoring. My tutoring subjects include: Physics, Mathematics and Mechanical engineering. I have also been awarded as best tutor for year 2019 in my previous organisation. Being a Mechanical Engineer, I love to tell the application of the concepts of science and mathematics in the real world. This help students to develop interest and makes learning fun and easy. This in turn, automatically improves their grades in the subject. I teach students to get prepared for college entry level exam. I also use to teach undergraduate students and guide them through their career aim.
2+ Reviews
10+ Question Solved
Related Book For 

Chemistry For Engineering Students
ISBN: 9780357026991
4th Edition
Authors: Lawrence S. Brown, Tom Holme
Question Posted:
