

Refer to Best Buys financial statements in Appendix A for the following questions. Required 1. What amount
Question:
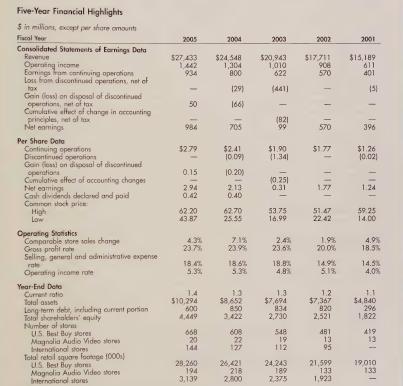
Refer to Best Buy’s financial statements in Appendix A for the following questions.
Required 1. What amount of total liabilities does Best Buy report for each of the fiscal years ended February 28, 2004, and February 26, 2005?
2. What amount of total assets does Best Buy report for each of the fiscal years ended February 28, 2004, and February 26, 2005?
Compute Best Buy’s debt ratio for each of the fiscal years ended February 28, 2004, and February 26, 2005.
In which fiscal year did Best Buy employ more financial leverage (February 28, 2004, or February 26, 2005)? Explain.
Fantastic news! We've Found the answer you've been seeking!
Step by Step Answer:

Answered By
Robert Mbae
I have been a professional custom essay writer for the last three years. Over that period of time, I have come to learn the value of focusing on the needs of the clients above everything else. With this knowledge, I have worked hard to become an acclaimed writer that can be trusted by the customers to handle the most important custom essays. I have the necessary educational background to handle projects up to the Ph.D. level. Among the types of projects that I've done, I can handle everything within Dissertations, Project Proposals, Research Papers, Term Papers, Essays, Annotated Bibliographies, and Literature Reviews, among others.
Concerning academic integrity, I assure you that you will receive my full and undivided attention through to the completion of every essay writing task. Additionally, I am able and willing to produce 100% custom writings with a guarantee of 0% plagiarism. With my substantial experience, I am conversant with all citation styles ranging from APA, MLA, Harvard, Chicago-Turabian, and their corresponding formatting. With all this in mind, I take it as my obligation to read and understand your instructions, which reflect on the quality of work that I deliver. In my paper writing services, I give value to every single essay order. Besides, whenever I agree to do your order, it means that I have read and reread your instructions and ensured that I have understood and interpreted them accordingly.
Communication is an essential part of a healthy working relationship. Therefore, I ensure that I provide the client with drafts way long before the deadline so that the customer can review the paper and comment. Upon completion of the paper writing service, the client has the time and right to review it and request any adjustments before releasing the payment.
1+ Reviews
10+ Question Solved
Related Book For 
College Accounting Ch 1-14
ISBN: 9780073346892
1st Edition
Authors: John Wild, Vernon Richardson, Ken Shaw
Question Posted:
