

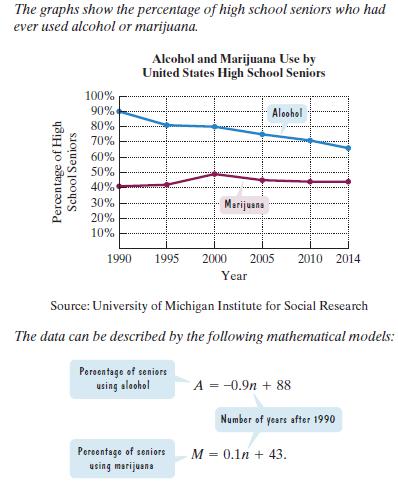
a. Use the appropriate line graph to estimate the percentage of seniors who used alcohol in 2014.
Question:
a. Use the appropriate line graph to estimate the percentage of seniors who used alcohol in 2014.
b. Use the appropriate formula to determine the percentage of seniors who used alcohol in 2014. How does this compare with your estimate in part (a)?
c. Use the appropriate line graph to estimate the percentage of seniors who used marijuana in 2014.
d. Use the appropriate formula to determine the percentage of seniors who used marijuana in 2014. How does this compare with your estimate in part (c)?
e. For the period from 1990 through 2014, in which year was alcohol use by seniors at a maximum? What percentage of seniors used alcohol in that year.
Fantastic news! We've Found the answer you've been seeking!
Step by Step Answer:
a According to the line graph about 66 of seniors used al...View the full answer

Answered By
Fahmin Arakkal
Tutoring and Contributing expert question and answers to teachers and students.
Primarily oversees the Heat and Mass Transfer contents presented on websites and blogs.
Responsible for Creating, Editing, Updating all contents related Chemical Engineering in
latex language
8+ Reviews
22+ Question Solved
Related Book For 

Question Posted:
