

America is getting older. The graph shows the projected elderly U.S. population for ages 6584 and for
Question:
America is getting older. The graph shows the projected elderly U.S. population for ages 65–84 and for ages 85 and older.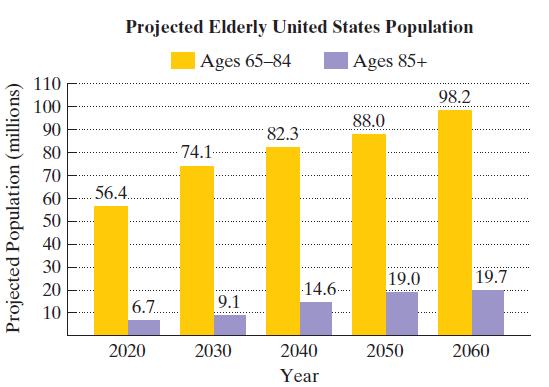
The formula E = 5.8√x + 56.4 models the projected number of elderly Americans ages 65–84, E, in millions, x years after 2020.
a. Use the formula to find the projected increase in the number of Americans ages 65–84, in millions, from 2030 to 2060. Express this difference in simplified radical form.
b. Use a calculator and write your answer in part (a) to the nearest tenth. Does this rounded decimal overestimate or underestimate the difference in the projected data shown by the bar graph on the previous page? By how much?
Fantastic news! We've Found the answer you've been seeking!
Step by Step Answer:
a b For 2030 E 58x564 5810564 For ...View the full answer

Answered By
Kumar shitanshu
I HAVE BEEN TEACHING FOR 7 YEARS NOW. I TEACH FINANCE, ECONOMICS, ACCOUNTING AND MATHEMATICS. I BELIEVE IN A CONCEPT BASED APPROACH TO EVERY PROBLEM.
0 Reviews
10+ Question Solved
Related Book For 

Question Posted:
