

Question: Between 1990 and 2013, there was a drop in violent crime and a spike in the prison population in the United States. The bar graph
Between 1990 and 2013, there was a drop in violent crime and a spike in the prison population in the United States. The bar graph shows the number of violent crimes per 100,000 people and the number of imprisonments per 100,000 people for six selected years from 1990 through 2013.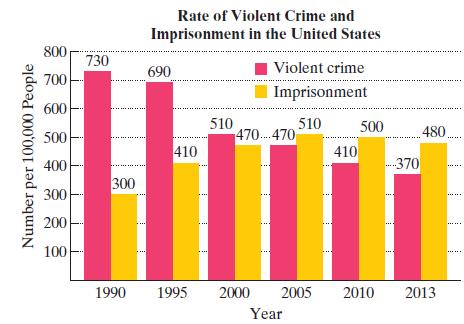
a. Based on the information in the graph, it appears that there was a year when the number of violent crimes per 100,000 Americans was the same as the number of imprisonments per 100,000 Americans. According to the graph, between which two years did this occur?
b. The data can be modeled by quadratic and linear functions.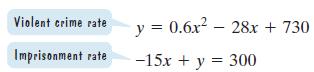 In each function, x represents the number of years after 1990 and y represents the number per 100,000 Americans. Solve a nonlinear system to determine the year described in part (a). Round to the nearest year. How many violent crimes per 100,000 Americans and how many imprisonments per 100,000 Americans were there in that year?
Number per 100,000 People 800 700 600 500 400 300 200 100 730 300 Rate of Violent Crime and Imprisonment in the United States 690 ..... 410 510 Violent crime Imprisonment 510 470....470 1990 1995 2000 2005 Year 410 500 2010 ....370 *********** 480. 2013
Step by Step Solution
3.55 Rating (166 Votes )
There are 3 Steps involved in it
a It appears from the graph that the number of violent crimes per 100000 Ame... View full answer

Get step-by-step solutions from verified subject matter experts