

Match the situation with the graph (a-d) that models it best, where x-values represent time. Height of
Question:
Match the situation with the graph (a-d) that models it best, where x-values represent time.
Height of the Empire State Building from 1990 to 2010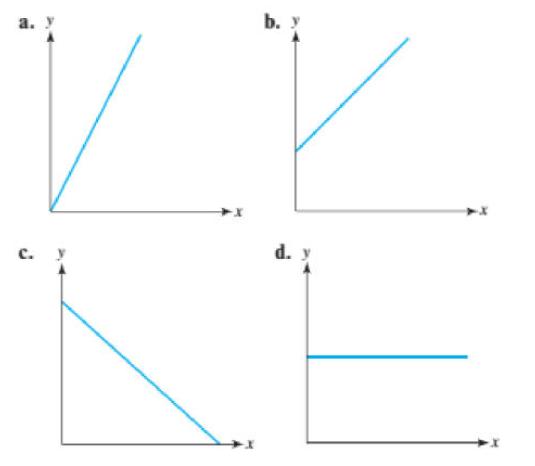
Fantastic news! We've Found the answer you've been seeking!
Step by Step Answer:
The height of the ...View the full answer

Answered By
Shubhradeep Maity
I am an experienced and talented freelance writer passionate about creating high-quality content. I have over five years of experience working in the field and have collaborated with several renowned companies and clients in the SaaS industry.
At Herman LLC, an online collective of writers, I generated 1,000+ views on my content and created journal content for 100+ clients on finance topics. My efforts led to a 60% increase in customer engagement for finance clients through revamping website pages and email interaction.
Previously, at Gerhold, a data management platform using blockchain, I wrote and published over 50 articles on topics such as Business Finance, Scalability, and Financial Security. I managed four writing projects concurrently and increased the average salary per page from $4 to $7 in three months.
In my previous role at Bernier, I created content for 40+ clients within the finance industry, increasing sales by up to 40%.
I am an accomplished writer with a track record of delivering high-quality content on time and within budget. I am dedicated to helping my clients achieve their goals and providing exceptional results.
1+ Reviews
10+ Question Solved
Related Book For 

College Algebra With Modeling And Visualization
ISBN: 9780134418049
6th Edition
Authors: Gary Rockswold
Question Posted:
