

The bar graph indicates that fewer U.S. adults are getting married. a. Use these models to determine
Question:
The bar graph indicates that fewer U.S. adults are getting married.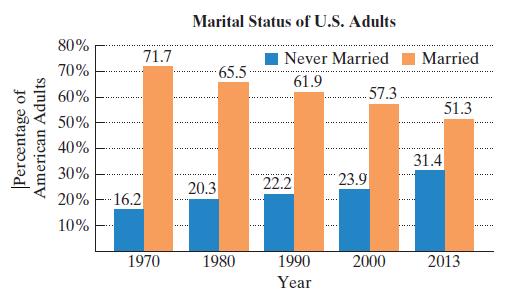
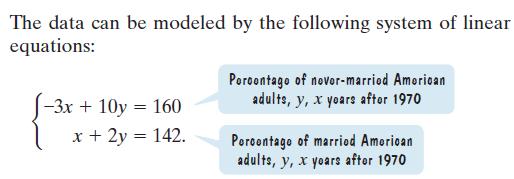
a. Use these models to determine the year, rounded to the nearest year, when the percentage of never-married adults will be the same as the percentage of married adults. For that year, approximately what percentage of Americans, rounded to the nearest percent, will belong to each group?
b. How is your approximate solution from part (a) shown by the following graphs?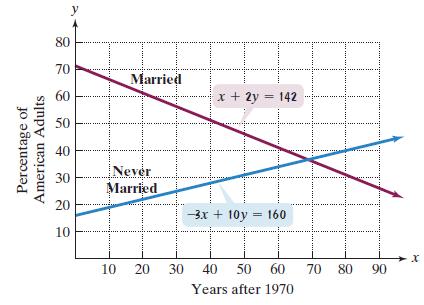
Fantastic news! We've Found the answer you've been seeking!
Step by Step Answer:
a b The answer from part a is represented by the intersection point 6937 3x10y 160 x2...View the full answer

Answered By
Carly Cimino
As a tutor, my focus is to help communicate and break down difficult concepts in a way that allows students greater accessibility and comprehension to their course material. I love helping others develop a sense of personal confidence and curiosity, and I'm looking forward to the chance to interact and work with you professionally and better your academic grades.
12+ Reviews
21+ Question Solved
Related Book For 

Question Posted:
