

The bar graph shows the amount, in billions of dollars, that the United States government spent on
Question:
The bar graph shows the amount, in billions of dollars, that the United States government spent on human resources and total budget outlays for six selected years. (Human resources include education, health, Medicare, Social Security, and veterans benefits and services.)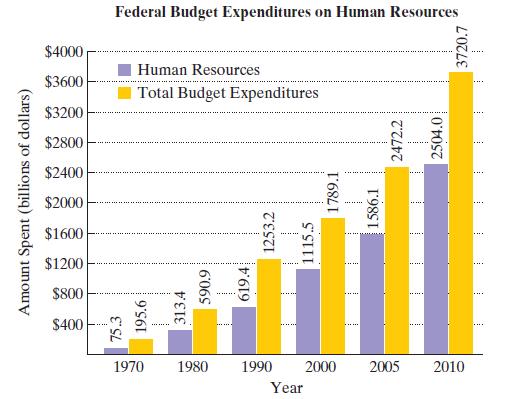 The function p(x) = 1.75x2 - 15.9x + 160 models the amount, p(x), in billions of dollars, that the United States government spent on human resources x years after 1970. The function q(x) = 2.1x2 - 3.5x + 296 models total budget expenditures, q(x), in billions of dollars, x years after 1970.a. Use p and q to write a rational function that models the fraction of total budget outlays spent on human resources x years after 1970.b. Use the data displayed by the bar graph to find the percentage of federal expenditures spent on human resources in 2010. Round to the nearest percent.c. Use the rational function from part (a) to find the percentage of federal expenditures spent on human resources in 2010. Round to the nearest percent. Does this underestimate or overestimate the actual percent that you found in part (b)? By how much?d. What is the equation of the horizontal asymptote associated with the rational function in part (a)? If trends modeled by the function continue, what percentage of the federal budget will be spent on human resources over time? Round to the nearest percent.
Step by Step Answer:
a b c d The degree of the numerator 2 is equal to the degree of the ...View the full answer


