

Question: The data in the table lists U.S. natural gas consumption in quadrillion BTUS. (a) Find a polynomial function that models the data. (b) Graph f
The data in the table lists U.S. natural gas consumption in quadrillion BTUS.
(a) Find a polynomial function that models the data.
(b) Graph f and the data together.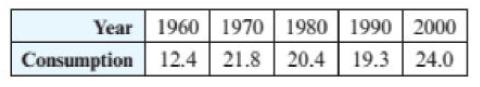
Year 1960 1970 1980 1990 2000 Consumption 12.4 21.8 20.4 19.3 24.0
Step by Step Solution
★★★★★
3.49 Rating (156 Votes )
There are 3 Steps involved in it
1 Expert Approved Answer
Step: 1 Unlock

a Using the regres... View full answer
Question Has Been Solved by an Expert!
Get step-by-step solutions from verified subject matter experts
Step: 2 Unlock
Step: 3 Unlock