

Question: The figure shows the graph of f(x) = ex. In Exercises 3546, use transformations of this graph to graph each function. Be sure to give
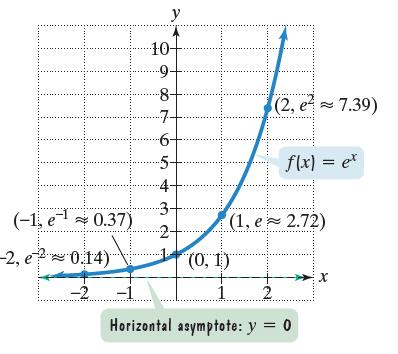
The figure shows the graph of f(x) = ex. In Exercises 35–46, use transformations of this graph to graph each function. Be sure to give equations of the asymptotes. Use the graphs to determine each function’s domain and range. If applicable, use a graphing utility to confirm your hand-drawn graphs.
 h(x) = e-x
(-1, 0.37) e- -2, e 0:14) -2 y 10- --9- -8- 5- (2, e 7.39) f(x) = et (1, e 2.72) (0, 1) 1 Horizontal asymptote: y = 0 X
Step by Step Solution
★★★★★
3.45 Rating (168 Votes )
There are 3 Steps involved in it
1 Expert Approved Answer
Step: 1 Unlock

The graph of hx ex can b... View full answer
Question Has Been Solved by an Expert!
Get step-by-step solutions from verified subject matter experts
Step: 2 Unlock
Step: 3 Unlock