

The figure shows the graph of f(x) = log x. In Exercises 5964, use transformations of this
Question:
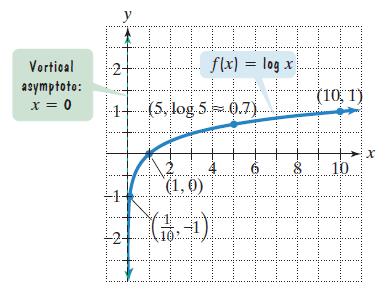
The figure shows the graph of f(x) = log x. In Exercises 59–64, use transformations of this graph to graph each function. Graph and give equations of the asymptotes. Use the graphs to determine each function’s domain and range.
 g(x) = 1 - log x
Fantastic news! We've Found the answer you've been seeking!
Step by Step Answer:
0 AV 45 11 51log ...View the full answer

Answered By
OTIENO OBADO
I have a vast experience in teaching, mentoring and tutoring. I handle student concerns diligently and my academic background is undeniably aesthetic
3+ Reviews
10+ Question Solved
Related Book For 

Question Posted:
