

The following graph shows U.S. Energy consumption. When was energy consumption increasing? Energy (millions of Btu) 400
Question:
The following graph shows U.S. Energy consumption.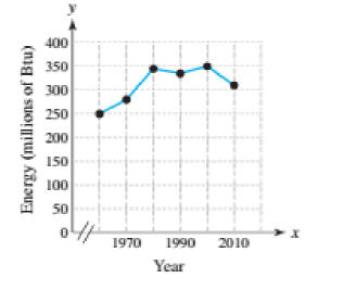
When was energy consumption increasing?
Fantastic news! We've Found the answer you've been seeking!
Step by Step Answer:
Energy consumptio...View the full answer

Answered By
BRIAN MUSINGA
I possess a Bachelors of Commerce degree(Marketing option) and am currently undertaking an MBA in marketing. I believe that I possess the required knowledge and skills to tutor in the subject named. I have also written numerous research academic papers much to the satisfaction of clients and my professors.
2+ Reviews
17+ Question Solved
Related Book For 

College Algebra With Modeling And Visualization
ISBN: 9780134418049
6th Edition
Authors: Gary Rockswold
Question Posted:
