

Question: The following table shows mobile device usage by Black Friday shoppers from 2010 to 2015. The middle column lists the percentages of online site traffic
The following table shows mobile device usage by Black Friday shoppers from 2010 to 2015. The middle column lists the percentages of online site traffic due to mobile devices (rather than PCs), and the third column lists the percentages of online sales.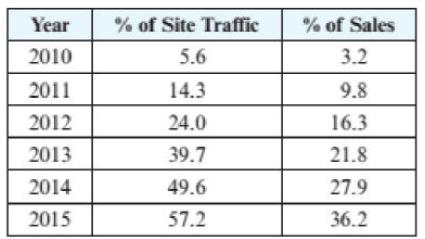
(Refer to Exercise 117.) For h(x) = ax + b, interpret the value of a.
Data from Exercise 117
Let x be the percentage of site traffic and y the percentage of sales. Use linear regression to find h(x) = ax + b that models the second and third columns. Predict the percentage of sales if the site traffic were to reach 70%.
Year 2010 2011 2012 2013 2014 2015 % of Site Traffic 5.6 14.3 24.0 39.7 49.6 57.2 % of Sales 3.2 9.8 16.3 21.8 27.9 36.2
Step by Step Solution
3.35 Rating (167 Votes )
There are 3 Steps involved in it
To interpret the value of a in the equation hx ax b we need to perform a linear regression analysis ... View full answer

Get step-by-step solutions from verified subject matter experts