

Question: The function models the pH level, f(x), of the human mouth x minutes after a person eats food containing sugar. The graph of this function
The function
 models the pH level, f(x), of the human mouth x minutes after a person eats food containing sugar. The graph of this function is shown in the figure.
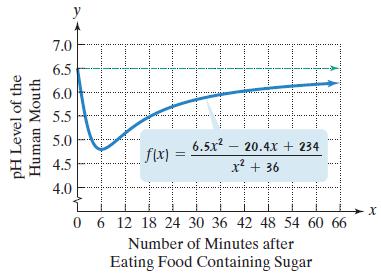 a. Use the graph to obtain a reasonable estimate, to the nearest tenth, of the pH level of the human mouth 42 minutes after a person eats food containing sugar.b. After eating sugar, when is the pH level the lowest? Use the function’s equation to determine the pH level, to the nearest tenth, at this time.c. According to the graph, what is the normal pH level of the human mouth?d. What is the equation of the horizontal asymptote associated with this function? Describe what this means in terms of the mouth’s pH level over time.e. Use the graph to describe what happens to the pH level during the first hour.
f(x) 6.5x 20.4x + 234 x + 36
Step by Step Solution
3.38 Rating (167 Votes )
There are 3 Steps involved in it
a From the graph the pH level of the human mouth 42 min... View full answer

Get step-by-step solutions from verified subject matter experts