

The graph gives the tides at Clearwater Beach, Florida, x hours after midnight on a particular day,
Question:
The graph gives the tides at Clearwater Beach, Florida, x hours after midnight on a particular day, where 0 ≤ x ≤ 27.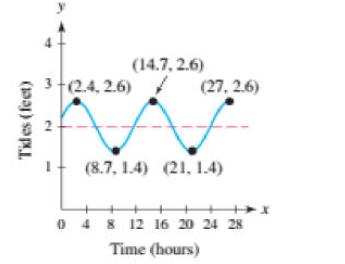
When were water levels decreasing?
Fantastic news! We've Found the answer you've been seeking!
Step by Step Answer:
According to the g...View the full answer

Answered By
Madhur Jain
I have 6 years of rich teaching experience in subjects like Mathematics, Accounting, and Entrance Exams preparation. With my experience, I am able to quickly adapt to the student's level of understanding and make the best use of his time.
I focus on teaching concepts along with the applications and what separates me is the connection I create with my students. I am well qualified for working on complex problems and reaching out to the solutions in minimal time. I was also awarded 'The Best Tutor Award' for 2 consecutive years in my previous job.
Hoping to get to work on some really interesting problems here.
1+ Reviews
10+ Question Solved
Related Book For 

College Algebra With Modeling And Visualization
ISBN: 9780134418049
6th Edition
Authors: Gary Rockswold
Question Posted:
