

Question: The graph illustrates home temperature, f(t), as a function of hours after midnight, t. In Exercises 137140, determine whether each statement makes sense or does
The graph illustrates home temperature, f(t), as a function of hours after midnight, t.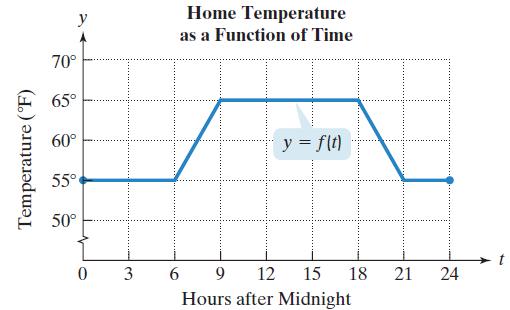 In Exercises 137–140, determine whether each statement makes sense or does not make sense, and explain your reasoning. If the statement makes sense, graph the new function on the domain [0, 24]. If the statement does not make sense, correct the function in the statement and graph the corrected function on the domain [0, 24].
I decided to change the heating schedule to start one hour earlier than before, so I reprogrammed the thermostat to y = f(t - 1).
Temperature (F) y 70 65 60 55 50 0 3 Home Temperature as a Function of Time y = f(t) 69 12 15 18 21 Hours after Midnight 24 t
Step by Step Solution
3.46 Rating (172 Votes )
There are 3 Steps involved in it
does not make ... View full answer

Get step-by-step solutions from verified subject matter experts