

The graph of y = f(x) shows the amount of water y in thousands of gallons remaining
Question:
The graph of y = f(x) shows the amount of water y in thousands of gallons remaining in a swimming pool after x days.
(a) Estimate the initial and final amounts of water in the pool.
(b) When did the amount of water in the pool remain constant?
(c) Approximate (2) and (4).
(d) At what rate was water being drained from the pool when I ≤ x ≤ 3?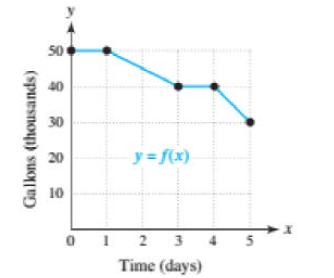
Fantastic news! We've Found the answer you've been seeking!
Step by Step Answer:
a Initial 50000 gallons Final 30000 ga...View the full answer

Answered By
Mary Njunu
I posses Vast, diversified knowledge and excellent grammar as a result of working in ACADEMIC WRITING for more than 5 years. I deliver work in various disciplines with assurance of quality work. I purpose at meeting the clients’ expectations precisely. Let’s work together for the best and phenomenal grades.
928+ Reviews
2551+ Question Solved
Related Book For 

College Algebra With Modeling And Visualization
ISBN: 9780134418049
6th Edition
Authors: Gary Rockswold
Question Posted:
