

What age groups are expected to be involved in 3 fatal crashes per 100 million miles driven?
Question:
What age groups are expected to be involved in 3 fatal crashes per 100 million miles driven? How well does the formula model the trend in the actual data shown in the bar graph?
A driver’s age has something to do with his or her chance of getting into a fatal car crash. The bar graph shows the number of fatal vehicle crashes per 100 million miles driven for drivers of various age groups. For example, 25-year-old drivers are involved in 4.1 fatal crashes per 100 million miles driven. Thus, when a group of 25-year-old Americans have driven a total of 100 million miles, approximately 4 have been in accidents in which someone died.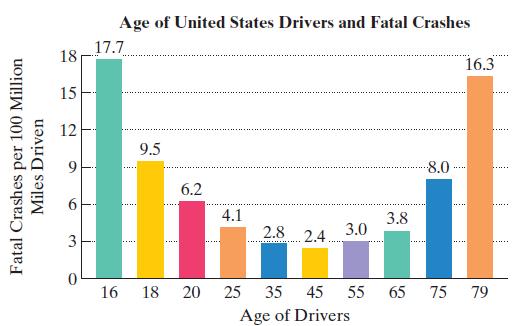 The number of fatal vehicle crashes per 100 million miles, N, for drivers of age x can be modeled by the formula
![]()
Step by Step Answer:
fx0013x 119x2824 30013x 119x2824 0013x119x2524 0 Apply the quadratic formul...View the full answer


