In Problems 2330, use a graphing utility to graph each polynomial function f. Follow Steps 1 through
Question:
In Problems 23–30, use a graphing utility to graph each polynomial function f. Follow Steps 1 through 8.
Transcribed Image Text:
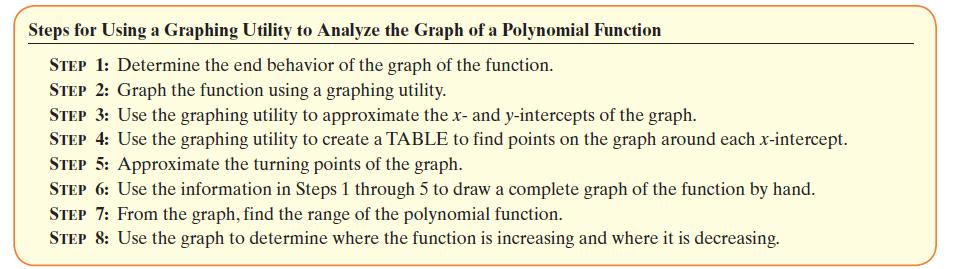
Steps for Using a Graphing Utility to Analyze the Graph of a Polynomial Function STEP 1: Determine the end behavior of the graph of the function. STEP 2: Graph the function using a graphing utility. STEP 3: Use the graphing utility to approximate the x- and y-intercepts of the graph. STEP 4: Use the graphing utility to create a TABLE to find points on the graph around each x-intercept. STEP 5: Approximate the turning points of the graph. STEP 6: Use the information in Steps 1 through 5 to draw a complete graph of the function by hand. STEP 7: From the graph, find the range of the polynomial function. STEP 8: Use the graph to determine where the function is increasing and where it is decreasing.
Fantastic news! We've Found the answer you've been seeking!
Step by Step Answer:
Answer rating: 63% (11 reviews)
fxx25x 05625 Step 1 Degree 4 The graph of the function resembles y x for l...View the full answer
Answered By
Jeff Omollo
As an educator I have had the opportunity to work with students of all ages and backgrounds. Throughout my career, I have developed a teaching style that encourages student engagement and promotes active learning. My education and tutoring skills has enabled me to empower students to become lifelong learners.
5.00+
5+ Reviews
42+ Question Solved
Related Book For
Question Posted:
Students also viewed these Mathematics questions
-
In Problems 2330, use a graphing utility to graph each polynomial function f. Follow Steps 1 through 8. Steps for Using a Graphing Utility to Analyze the Graph of a Polynomial Function STEP 1:...
-
In Problems 2330, use a graphing utility to graph each polynomial function f. Follow Steps 1 through 8. Steps for Using a Graphing Utility to Analyze the Graph of a Polynomial Function STEP 1:...
-
In Problems 2330, use a graphing utility to graph each polynomial function f. Follow Steps 1 through 8. Steps for Using a Graphing Utility to Analyze the Graph of a Polynomial Function STEP 1:...
-
Measure each amount given in Problems 1721. a. Container C in ounces b. Container C in milliliters mL 500- 400- 300 200- 100 cups 2 1 -16-ez -14 oz -12 oz -110 oz 8 oz -16 oz -4 oz 2 oz Container C...
-
What distinctions can you make between affirmative action and managing diversity?
-
Find the median and the lower and upper quartiles for the data on times until recurrence of an illness in Exercise 2.57. Use these descriptive measures to construct a box plot for the data. Use the...
-
Identify the most appropriate approach and then design. Provide a rationale as to why this approach and design would be most appropriate. Develop a hypothetical research scenario that would...
-
As manager of the St. Cloud Theatre Company, you have decided that concession sales will support themselves. The following table provides the information you have been able to put together thus far:...
-
Mary, Shannon, and Anika each invested $9,000, $25,000, and $18,000, respectively, into a business. a. Calculate their investment ratio reduced to the lowest terms. 0 : 0 : 0
-
In Problems 2532, use the given zero to find the remaining zeros of each polynomial function. f(x) = 4x4 + 7x +62x + 112x - 32; zero: -4i
-
In Problems 1954, solve each inequality algebraically. (x + 1) (x + 2) (x + 3) 0
-
What are the ways to improve a product mix? Describe two approaches to use existing products to strengthen a product mix.
-
Two researchers were given the task of analyzing the demographic characteristics of job fair participants. The first researcher collected a sample of 100, and the second researcher collected a sample...
-
A testing company pre-tests a new drink. Of the 100 people who tasted the drink, 65 liked it. a. Can you assume that the sampling distribution of the proportion is approximately normal? b. Calculate...
-
Investigating the sample size of 35, the sample mean and were found to be 15 and 2. Construct a 95% confidence interval for .
-
Assume that your investment with your chosen company stocks produced 12% return for the first year and 28% return on the second year of operations. Calculate the geometric rate of return per year....
-
Information from the records of Smart Manufacturing Systems Pty Ltd for the year ended 30 June 2019 is given below. Required (a) Calculate the cost of work in process inventory on 1 July 2018....
-
Explain the difference between a one-tailed and a two-tailed test.
-
Define relevant costs and discuss: (1) whether all future costs are relevant for decision making and (2) whether variable costs are always relevant and fixed costs are always irrelevant
-
Solve each equation. Give solutions in exact form. ln (7 - x) + ln (1 - x) = ln (25 - x)
-
Solve the equation. Give solutions in exact form. ln (3 - x) + ln (5 - x) = ln (50 - 6x)
-
Solve the equation. Give solutions in exact form. log 8 (x + 2) + log 8 (x + 4) = log 8 8
-
What does a database administrator (DBA) do? Please explain their output using below 1. Process 2. Dealings with internal customers 3. Financial impact i.e. cost containment or budget or revenue
-
A debt security is an instrument representing a creditor relationship with an entity. Debt securities include U.S. government securities, municipal securities, corporate bonds, convertible debt, and...
-
ABC corporation stock is selling for Rs. 150 per share according to Karachi stock exchange market summary. A rumor about the company has been heard that the firm will make an exciting new product...
Study smarter with the SolutionInn App