

Question: Solve each problem by locating ordered pairs on the graphs. The graph shows the percentage of Americans who moved in selected years. (a) If the
Solve each problem by locating ordered pairs on the graphs. The graph shows the percentage of Americans who moved in selected years.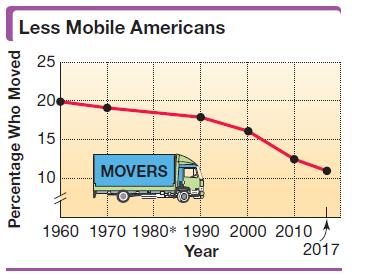 (a) If the ordered pair (x, y) represents a point on the graph, what does x represent? What does y represent?(b) Estimate the percentage of Americans who moved in 2017.(c) Write an ordered pair (x, y) that gives the approximate percentage of Americans who moved in 2017.(d) What does the ordered pair (1960, 20) mean in the context of this graph?
Less Mobile Americans 25 Percentage Who Moved 20 15 10 MOVERS 1960 1970 1980* 1990 2000 2010 Year 2017
Step by Step Solution
3.38 Rating (170 Votes )
There are 3 Steps involved in it
a x represents the number of year in reference to the given gra... View full answer

Get step-by-step solutions from verified subject matter experts