

Question: The data in the table below represent the percent of U.S. citizens aged 12 and older who have a profile on at least one social
The data in the table below represent the percent of U.S. citizens aged 12 and older who have a profile on at least one social network.
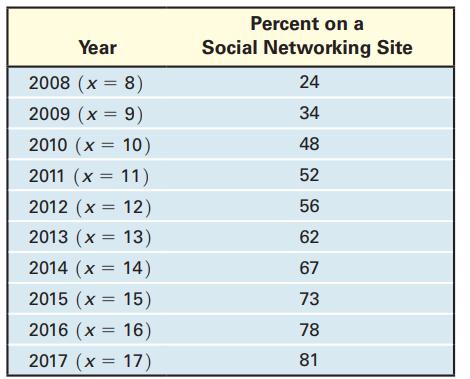
(a) Using a graphing utility, draw a scatter plot of the data using 8 for 2008, 9 for 2009, and so on, as the independent variable, and percent on social networking site as the dependent variable.
(b) Using a graphing utility, build a logarithmic model from the data.
(c) Graph the logarithmic function found in part (b) on the scatter plot.
(d) Use the model to predict the percent of U.S. citizens on social networking sites in 2019.
(e) Use the model to predict the year in which 98% of U.S. citizens will be on social networking sites.
Year 2008 (x = 8) 2009 (x = 9) 2010 (x = 10) 2011 (x = 11) 2012 (x = 12) 2013 (x = 13) 2014 (x = 14) 2015 (x = 15) 2016 (x = 16) 2017 (x = 17) Percent on a Social Networking Site 24 34 48 52 56 62 67 73 78 81
Step by Step Solution
3.34 Rating (160 Votes )
There are 3 Steps involved in it
a b c d e NORMAL ... View full answer

Get step-by-step solutions from verified subject matter experts