

The following data represent the birth rate (births per 1000 population) for women whose age is a,
Question:
The following data represent the birth rate (births per 1000 population) for women whose age is a, in 2016.
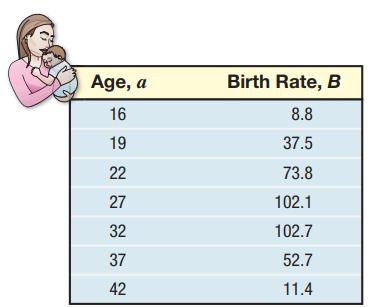
(a) Using a graphing utility, draw a scatter plot of the data, treating age as the independent variable. What type of relation appears to exist between age and birth rate?
(b) Based on your response to part (a), find either a linear or a quadratic model that describes the relation between age and birth rate.
(c) Use your model to predict the birth rate for 35-year-old women.
Fantastic news! We've Found the answer you've been seeking!
Step by Step Answer:
a b c NORMAL FLOAT AUTO R...View the full answer

Answered By
Michael Mulupi
I am honest,hardworking, and determined writer
72+ Reviews
157+ Question Solved
Related Book For 

Question Posted:
