

Question: The graph of a function is shown in the figure. Sketch the graph of each function defined as follows. (a) y = (x) +
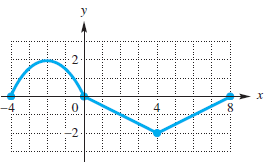
The graph of a function ƒ is shown in the figure. Sketch the graph of each function defined as follows.
(a) y = ƒ(x) + 3
(b) y = ƒ(x - 2)
(c) y = ƒ(x + 3) - 2
(d) y = |ƒ(x)|
.2.
Step by Step Solution
★★★★★
3.30 Rating (171 Votes )
There are 3 Steps involved in it
1 Expert Approved Answer
Step: 1 Unlock

a To graph y f x 3 translate the graph of y fx 3 units up b To graph y ... View full answer
Question Has Been Solved by an Expert!
Get step-by-step solutions from verified subject matter experts
Step: 2 Unlock
Step: 3 Unlock