

The graph shows dollars (in billions) spent for general science and for space/other technologies in selected years.
Question:
The graph shows dollars (in billions) spent for general science and for space/other technologies in selected years.
G (x) represents the dollars spent for general science.
S (x) represents the dollars spent for space and other technologies.
T (x) represents the total expenditures for these two categories.
Science and Space Spending
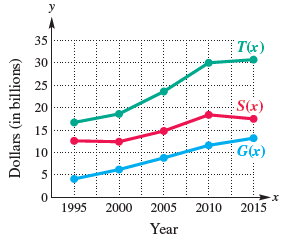
In which period does spending for T(x) increase most?
Fantastic news! We've Found the answer you've been seeking!
Step by Step Answer:
Total spend...View the full answer

Answered By
Utsab mitra
I have the expertise to deliver these subjects to college and higher-level students. The services would involve only solving assignments, homework help, and others.
I have experience in delivering these subjects for the last 6 years on a freelancing basis in different companies around the globe. I am CMA certified and CGMA UK. I have professional experience of 18 years in the industry involved in the manufacturing company and IT implementation experience of over 12 years.
I have delivered this help to students effortlessly, which is essential to give the students a good grade in their studies.
2+ Reviews
10+ Question Solved
Related Book For 

College Algebra
ISBN: 978-0134697024
12th edition
Authors: Margaret L. Lial, John Hornsby, David I. Schneider, Callie Daniels
Question Posted:
