

The graph shows profits and losses in thousands of dollars for a company.(a) What was the total
Question:
The graph shows profits and losses in thousands of dollars for a company.(a) What was the total profit or loss for the years 2015 through 2018?(b) Find the difference between the profit or loss in 2018 and that in 2017.(c) Find the difference between the profit or loss in 2016 and that in 2015.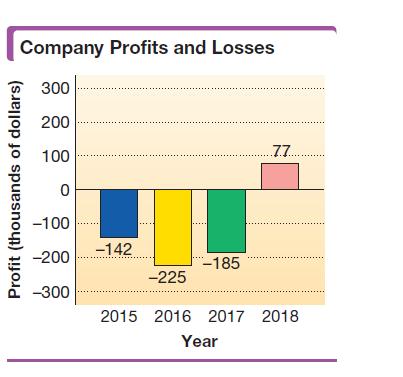
Fantastic news! We've Found the answer you've been seeking!
Step by Step Answer:
a total profit or loss for the year 2015 through 2018 no...View the full answer

Answered By
Sri Ram
i teach students past 2yrs as a home tutor. my expertise subject is mathematics. i choose teachings because its helps to enhance knowledge, skills , values.
0 Reviews
10+ Question Solved
Related Book For 

Intermediate Algebra
ISBN: 9780134895987
13th Edition
Authors: Margaret Lial, John Hornsby, Terry McGinnis
Question Posted:
