

The graph shows the number of drive-in movie theaters in the United States from 2010 through 2017.
Question:
The graph shows the number of drive-in movie theaters in the United States from 2010 through 2017.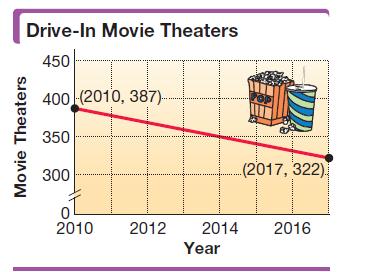
(a) Use the given ordered pairs to find the average rate of change in the number of drive-in theaters per year during this period. Round the answer to the nearest whole number.(b) Explain how a negative slope is interpreted in this situation.
Fantastic news! We've Found the answer you've been seeking!
Step by Step Answer:
a To find the average rate of change in the number of drivein theaters per year during ...View the full answer

Answered By
Diana Muriuki
As an online math tutor, I have several years of hands-on experience working with students of all ages and skill levels. I hold a Bachelor's degree in Mathematics and a Master's degree in Education. Additionally, I have completed multiple training courses in online teaching and tutoring methods.
Throughout my career, I have worked with students in both individual and group settings, including classroom teaching, after-school tutoring, and online instruction. I am proficient in teaching a wide range of math topics, from basic arithmetic to advanced calculus and statistics.
One of my greatest strengths as a tutor is my ability to adapt my teaching style to meet the unique needs and learning styles of each individual student. I understand that every student is different, and I strive to create a comfortable and supportive learning environment that encourages growth and development.
In addition to my formal education and tutoring experience, I am also a lifelong learner with a passion for mathematics. I am constantly seeking out new resources and methods to improve my own knowledge and skills, and I believe this passion and enthusiasm helps to inspire my students as well.
Overall, my hands-on experience and proficiency as a math tutor are grounded in a combination of formal education, practical experience, and a genuine love of mathematics. I am confident in my ability to help students achieve their goals and succeed in math, and I look forward to the opportunity to work with new students and continue to grow as an educator.
0 Reviews
10+ Question Solved
Related Book For 
Intermediate Algebra
ISBN: 9780134895987
13th Edition
Authors: Margaret Lial, John Hornsby, Terry McGinnis
Question Posted:
