

The graph shows the winning times (in minutes) at the Olympic Games for the mens 5000-m run,
Question:
The graph shows the winning times (in minutes) at the Olympic Games for the men’s 5000-m run, together with a linear approximation of the data.
Olympic Times for 5000-Meter Run (in minutes)
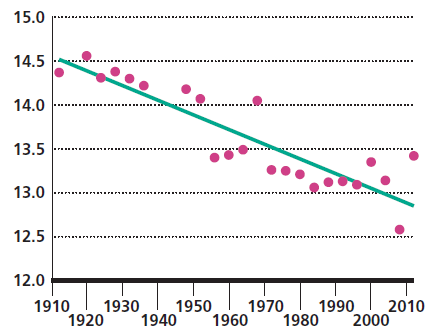
(a) An equation for a linear model, based on data from 1912–2012 (where x represents the year), is y = -0.0167x + 46.45.Determine the slope. What does the slope of this line represent? Why is the slope negative?
(b) What reason might explain why there are no data points for the years 1916, 1940, and 1944?
(c) The winning time for the 2000 Olympic Games was 13.35 min. What does the model predict to the nearest hundredth? How far is the prediction from the actual value?
Step by Step Answer:
a The slope of 00167 indicates that the average rate of change of the winning ...View the full answer


College Algebra
ISBN: 978-0134697024
12th edition
Authors: Margaret L. Lial, John Hornsby, David I. Schneider, Callie Daniels
