

The percents of revenue for public colleges from state sources and tuition are modeled in the accompanying
Question:
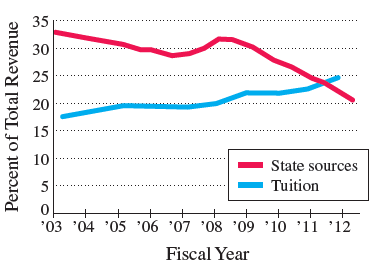
The percents of revenue for public colleges from state sources and tuition are modeled in the accompanying graph.
(a) Interpret this graph. How are the sources of funding for public colleges changing with time?
(b) During what time period was the revenue from state sources increasing?
(c) Use the graph to estimate the year and the percent when the amounts from both sources were equal.
Public College Revenue from Tuition and State Sources
Fantastic news! We've Found the answer you've been seeking!
Step by Step Answer:
a Revenue for public colleges from state sources ...View the full answer

Answered By
Joseph Mwaura
I have been teaching college students in various subjects for 9 years now. Besides, I have been tutoring online with several tutoring companies from 2010 to date. The 9 years of experience as a tutor has enabled me to develop multiple tutoring skills and see thousands of students excel in their education and in life after school which gives me much pleasure. I have assisted students in essay writing and in doing academic research and this has helped me be well versed with the various writing styles such as APA, MLA, Chicago/ Turabian, Harvard. I am always ready to handle work at any hour and in any way as students specify. In my tutoring journey, excellence has always been my guiding standard.
1+ Reviews
10+ Question Solved
Related Book For 

College Algebra
ISBN: 978-0134697024
12th edition
Authors: Margaret L. Lial, John Hornsby, David I. Schneider, Callie Daniels
Question Posted:
