

Question: Use the graph shown in FIGURE 1 at the beginning of this section (and repeated here) to work each exercise. Between which two years were
Use the graph shown in FIGURE 1 at the beginning of this section (and repeated here) to work each exercise.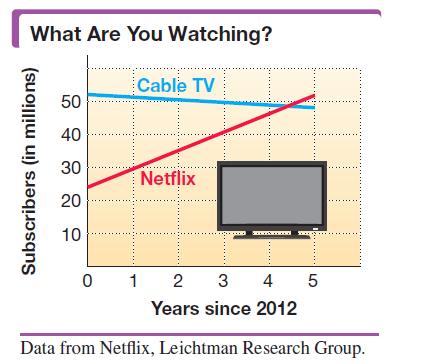
Between which two years were the numbers of Netflix and cable TV subscribers the same? About how many people subscribed to each video content provider at that point?
What Are You Watching? Subscribers (in millions) 50 40 30 20 10 Cable TV Netflix 3 4 Years since 2012 Data from Netflix, Leichtman Research Group. 0 1 2 5
Step by Step Solution
3.33 Rating (168 Votes )
There are 3 Steps involved in it
To determine the years when the numbers of Netflix and cable TV subscribers were t... View full answer

Get step-by-step solutions from verified subject matter experts