

Data for U.S. honey production are given in the table for the years 1990 through 2015. (A)
Question:
Data for U.S. honey production are given in the table for the years 1990 through 2015.
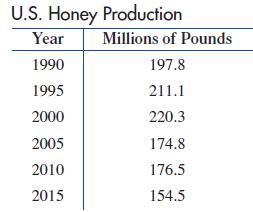
(A) Find the least squares line for the data, using x = 0 for 1990.
(B) Use the least squares line to predict U.S. honey production in 2030.
Fantastic news! We've Found the answer you've been seeking!
Step by Step Answer:
Solution A Find the least squares line for the data using x 0 for 1990 First ...View the full answer

Answered By
Labindao Antoque
I graduated in 2018 with a Bachelor of Science degree in Psychology from Dalubhasaan ng Lungsod ng San Pablo. I tutored students in classes and out of classes. I use a variety of strategies to tutor students that include: lecture, discussions about the subject matter, problem solving examples using the principles of the subject matter being discussed in class , homework assignments that are directed towards reinforcing what we learn in class , and detailed practice problems help students to master a concept. I also do thorough research on Internet resources or textbooks so that I know what students need to learn in order to master what is being taught in class .
0 Reviews
10+ Question Solved
Related Book For 

College Mathematics For Business Economics, Life Sciences, And Social Sciences
ISBN: 978-0134674148
14th Edition
Authors: Raymond Barnett, Michael Ziegler, Karl Byleen, Christopher Stocker
Question Posted:
