

Question: Problem require a graphing calculator or a computer that can calculate the linear regression line for a given data set. Table 17 contains pricesupply data
Problem require a graphing calculator or a computer that can calculate the linear regression line for a given data set.
Table 17 contains price–supply data and price–demand data for soybeans. Find a linear regression model for the price–supply data where x is supply (in billions of bushels) and y is price (in dollars). Do the same for the price–demand data. (Round regression coefficients to two decimal places.) Find the equilibrium price for soybeans.
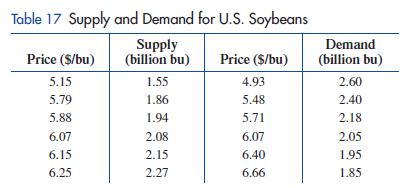
Table 17 Supply and Demand for U.S. Soybeans Supply (billion bu) Demand Price ($/bu) Price ($/bu) (billion bu) 5.15 1.55 4.93 2.60 5.79 1.86 5.48 2.40 5.88 1.94 5.71 2.18 6.07 2.08 6.07 2.05 6.15 2.15 6.40 1.95 6.25 2.27 6.66 1.85
Step by Step Solution
3.48 Rating (161 Votes )
There are 3 Steps involved in it
Supply y 153x 285 Demand y 221x 1066 To ... View full answer

Get step-by-step solutions from verified subject matter experts