

Table 2 gives U.S. high school dropout rates as percentages for selected years since 1990. A linear
Question:
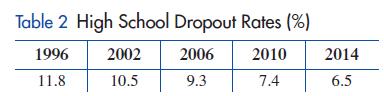
Table 2 gives U.S. high school dropout rates as percentages for selected years since 1990. A linear regression model for the data is
r = -0.308t + 13.9
where t represents years since 1990 and r is the dropout rate.
(A) Interpret the slope of the model.
(B) Draw a scatter plot of the data and the model in the same coordinate system.
(C) Use the model to predict the first year for which the dropout rate is less than 3%.
Fantastic news! We've Found the answer you've been seeking!
Step by Step Answer:
a The dropout rate is decreasing at a ...View the full answer

Answered By
Pushpinder Singh
Currently, I am PhD scholar with Indian Statistical problem, working in applied statistics and real life data problems. I have done several projects in Statistics especially Time Series data analysis, Regression Techniques.
I am Master in Statistics from Indian Institute of Technology, Kanpur.
I have been teaching students for various University entrance exams and passing grades in Graduation and Post-Graduation.I have expertise in solving problems in Statistics for more than 2 years now.I am a subject expert in Statistics with Assignmentpedia.com.
3+ Reviews
10+ Question Solved
Related Book For 

College Mathematics For Business Economics, Life Sciences, And Social Sciences
ISBN: 978-0134674148
14th Edition
Authors: Raymond Barnett, Michael Ziegler, Karl Byleen, Christopher Stocker
Question Posted:
