

Table 3 contains pricedemand and total cost data from a bakery for the production of kringles (a
Question:
Table 3 contains price–demand and total cost data from a bakery for the production of kringles (a Danish pastry), where p is the price (in dollars) of a kringle for a daily demand of x kringles and C is the total cost (in dollars) of producing x kringles.
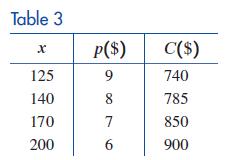
(A) Find a linear regression equation for the price–demand data, using x as the independent variable.
(B) Find a linear regression equation for the cost data, using x as the independent variable. Use this equation to estimate the fixed costs and variable costs per kringle.
(C) Find the break-even points.
(D) Find the price range for which the bakery will make a profit.
Fantastic news! We've Found the answer you've been seeking!
Step by Step Answer:
A B C D Lin...View the full answer

Answered By
Mohd Rehan
I teach in a local coaching centre for 4 years in Aligarh India. I am pursuing PhD from AMU Aligarh. I am all India qualified tests NET (National Eligibility Test) and GATE. Four certificates from NPTEL (1) Medicinal chemistry from IISER Pune, (2) Retrosynthesis from IIT Kharagpur (3) Application of NMR from IISc Bangalore, (4) Multidimensional NMR from IISc Bangalore. Eight research articles have been published in the chemistry field.
0 Reviews
10+ Question Solved
Related Book For 

College Mathematics For Business Economics, Life Sciences, And Social Sciences
ISBN: 978-0134674148
14th Edition
Authors: Raymond Barnett, Michael Ziegler, Karl Byleen, Christopher Stocker
Question Posted:
