

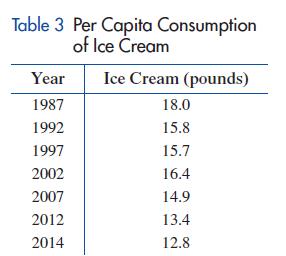
Table 3 shows the per capita consumption of ice cream in the United States for selected years
Question:
Table 3 shows the per capita consumption of ice cream in the United States for selected years since 1987.
(A) Let x represent the number of years since 1980 and find a cubic regression polynomial for the per capita consumption of ice cream.
(B) Use the polynomial model from part (A) to estimate (to the nearest tenth of a pound) the per capita consumption of ice cream in 2023.
Fantastic news! We've Found the answer you've been seeking!
Step by Step Answer:
To find a cubic regression polynomial for the per capita consumption of ice cream we first need to c...View the full answer

Answered By
Chandrasekhar Karri
I have tutored students in accounting at the high school and college levels. I have developed strong teaching methods, which allow me to effectively explain complex accounting concepts to students. Additionally, I am committed to helping students reach their academic goals and providing them with the necessary tools to succeed.
0 Reviews
10+ Question Solved
Related Book For 

College Mathematics For Business Economics, Life Sciences, And Social Sciences
ISBN: 978-0134674148
14th Edition
Authors: Raymond Barnett, Michael Ziegler, Karl Byleen, Christopher Stocker
Question Posted:
