

Table 5 shows the marriage and divorce rates per 1,000 population for selected years since 1960. (A)
Question:
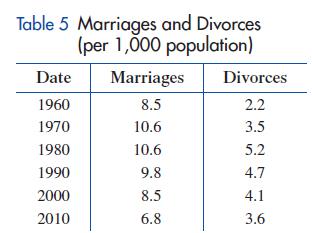
Table 5 shows the marriage and divorce rates per 1,000 population for selected years since 1960.
(A) Let x represent the number of years since 1960 and find a cubic regression polynomial for the marriage rate.
(B) Use the polynomial model from part (A) to estimate the marriage rate (to one decimal place) for 2025.
Fantastic news! We've Found the answer you've been seeking!
Step by Step Answer:
A To find a cubic regression polynomial for the marriage rate we can use a statistical software o...View the full answer

Answered By
Chandrasekhar Karri
I have tutored students in accounting at the high school and college levels. I have developed strong teaching methods, which allow me to effectively explain complex accounting concepts to students. Additionally, I am committed to helping students reach their academic goals and providing them with the necessary tools to succeed.
0 Reviews
10+ Question Solved
Related Book For 

College Mathematics For Business Economics, Life Sciences, And Social Sciences
ISBN: 978-0134674148
14th Edition
Authors: Raymond Barnett, Michael Ziegler, Karl Byleen, Christopher Stocker
Question Posted:
