

Table 9 contains the state population and the number of licensed drivers in the state (both in
Question:
Table 9 contains the state population and the number of licensed drivers in the state (both in millions) for the most populous states in 2014. The regression model for this data is
y = 0.62x + 0.29
where x is the state population (in millions) and y is the number of licensed drivers (in millions) in the state.
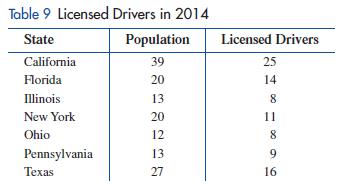
(A) Draw a scatter plot of the data and a graph of the model on the same axes.
(B) If the population of Michigan in 2014 was about 9.9 million, use the model to estimate the number of licensed drivers in Michigan in 2014 to the nearest thousand.
(C) If the number of licensed drivers in Georgia in 2014 was about 6.7 million, use the model to estimate the population of Georgia in 2014 to the nearest thousand.
Step by Step Answer:


College Mathematics For Business Economics, Life Sciences, And Social Sciences
ISBN: 978-0134674148
14th Edition
Authors: Raymond Barnett, Michael Ziegler, Karl Byleen, Christopher Stocker
